1 min read
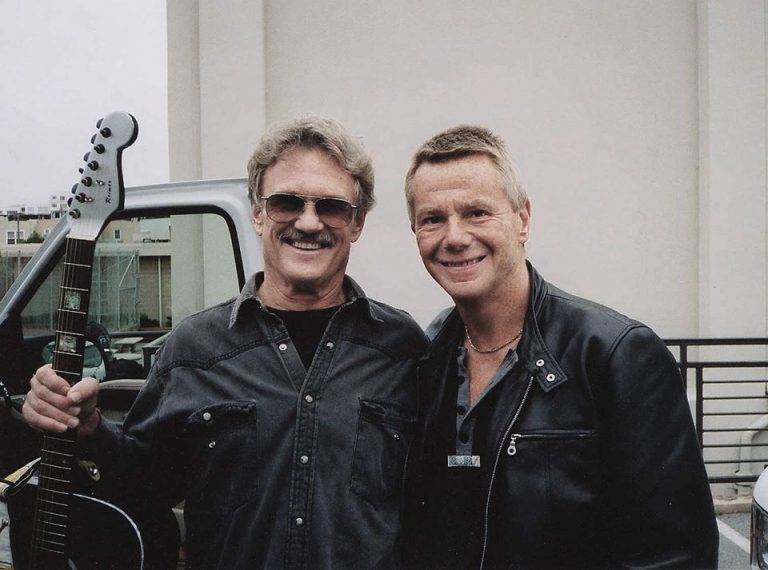
The 2002 Broken Freedom Tour was special. I don't know why - I wasn't there but I have read the...
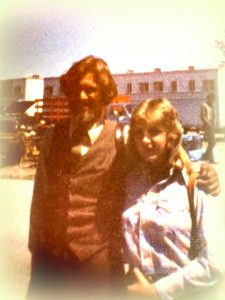
Kris Kristofferson by Fans, for Fans
In appreciation of the Silver Tongued Devil
The 2002 Broken Freedom Tour was special. I don't know why - I wasn't there but I have read the...
 13 min read
 2 min read