Skip to content
April 19, 2024
Kris Kristofferson by Fans, for Fans
In appreciation of the Silver Tongued Devil
Primary Menu
About Kris Kristofferson
Kris Kristofferson Bio
Coolidge Kristofferson Jones Family 1972
Kris Kristofferson – Bio
Kris Kristofferson’s Short Stories
Kristofferson Music Bio
Band Tales Road Talk
Bio & History
Fan Pix & Vids
Belfast Waterfront 2018
Best Fan Vids Around the World
Joe’s Mancave
Kris jams with Merle’s band
Kris Kristofferson and Helen Kiddle
Kris Kristofferson Basel, 17 June 2018
Kris Kristofferson Black & White
Kris Kristofferson Cross Stitch
Kris Kristofferson May 2017
Kris Kristofferson Private Collection
Kris Kristofferson Sketches
Kris Kristofferson Tour 2012
Kris Kristofferson Tour 2018 – Essen, Germany 13 June 2018
Kris Kristofferson Tour 2018 Sweden
Kristofferson – Baton Rouge 2018
Kristofferson 1991
Kristofferson Dublin Ireland 2018
Kristofferson European Tour Highlights
Kristofferson Nuremberg 2018 June 20th
Megan Coreno
Mike Wilkinson
Moment of Forever – with Kris Kristofferson 2011
Petter Alvestad – On Kristofferson’s Bus
Ulster Hall, Belfast, 1995
Vicki Krzanich, Wellington, October 2019
Who loves Kris Kristofferson?
Kris & Boris
Kris Kristofferson Ireland (Dublin) April 1982
FanMail
Bobby Bear Sings Kristofferson
Busking Music City, England
Damn Right : Here comes that Rainbow
Demons, Devils and Dues, by Emily Gmitter
From John Williams
How did you become a Kris Kristofferson Fan?
Jaime Cothron
Joe Jakubowski
Johan Sjöstrand
Kris (Kristofferson) & Carol (VIP)
Kris and Willie – Laughs & Autographs
Kristofferson & the Strangers – A gig Review
Kristofferson Dreams
Kristofferson, Harlan and James Hardie McGehee
Maybe I’ll Listen
Ode to John Prine & Kris Kristofferson
Sheila, Kris & Danny Timms 1995
The Concert – Art by Fans, for Fans
The Fighter (Written on a Sunday)
The Mirror Peter Walsh – a birthday gift for Kris Kristofferson
Gig reviews
Home
Kris Kristofferson 2015 new album to be released
Kris Kristofferson 2016
Kris Kristofferson 2019 Tour Talk
Kris Kristofferson fans speak about the latest Star is Born Remake
Kris Kristofferson Lyrics – Corrected by his Fans
Blame it on the Stones – Lyrics
To Beat the Devil
Kristofferson at Home – off the Road
Kristofferson Best Links
Kristofferson European Tour 2019
Kristofferson Fan Club: by Fans, for Fans
Kristofferson Fan Shop
Breakaway
Kristofferson Films
Kristofferson Hangouts & Haunts
Kristofferson Norway 2019 feat the Strangers
Kristofferson UK Tour 2019
Kristofferson’s Activism & Causes
Amnesty International 2012
Bring Me the Head of Alfredo Garcia
Censorship
Kris in Nicaragua (1989)
Kristofferson & Leonard Peltier
Kristofferson Unicef Gift of Song ’79
War Child UK 2017
Latest News
A Star is Born – Again?
Abilene – new Kristofferson movie 2017 – Hickok
April 2015
Imagine John Lennon and Kris Kristofferson
Kris & Kelly Kristofferson in Traded
Kris Kristofferson @ Glasto ’17
Kristofferson from Kentucky by Telegram 23 May 2017
Kristofferson on Tour 2015
Out with the Old
Pictures from the Kris Kristofferson tribute show
The Red Maple Leaf
Kris covers for Merle at the Strawberry Festival 2016
Me & Legal bits
Credits & Copyright
Privacy Policy
Newsreel / Posts
Personal
Did Elvis Record Why Me ?
Kris & Elvis
Kris & Emily – Unforgettable San Francisco 2002
Kris & Fred Foster
Kris & Waylon
Kris Kristofferson – Lisa’s story, a Moment of Forever
Kris Kristofferson & Kirk Smith
Kris Kristofferson & Roddy Hart
Kris Kristofferson Roadtrip
Kristofferson & Scorsese
Kristofferson joined by Rita Coolidge 2015 follows tragedy
Yellow Feather
Products
Road Talk Q & A
Services
Shop
Sunday Morning Coming Down – Christian opinion
The 1970s
Kris & Janis 1970
Kristofferson Live 1970 on stage – High Quality Video
Me and Bobby McGee
Sabre and the Rose
Why Me – the story
Kristofferson 1972
The Man and His Music
’90s Links
60s
Kris Kristofferson played Tootsies
80s
1985 Highwaymen First Gig
Artist shares a pic with Kris
Kristofferson remembers
Millenium
Kris Kristofferson Concert & Interview 2008
Kris Kristofferson gigging @ Glasto
Kris Kristofferson South Africa 2014
Kristofferson 2015 Duet with Lily Meola
Kristofferson Concert Review – by Paul Friesen
Kristofferson Concert Review, 17 November 2018
Kristofferson Concert tickets
Kristofferson: Colonial Theatre 2 May 2017
Hemingway’s Whiskey 2011
Kris kristofferson 2015
Hallur & Kris 2013
New Kristofferson album 2016
The Winding Stream – Carters, Cashes and Country Film
Tour Tickets News
Video
Writings by Kris Kristofferson
Gone are the Days
Search for:
Home
Galleries
Outlaws and Legends
Outlaws and Legends
Outlaws and Legends Soundcheck 2019 – Photos by C Roshkind
You may have missed
13 min read
1954
Fiction
Uncategorized
Works
Gone Are The Days
1 year ago
Kris Fan
2 min read
2
Fans Speak
Film
Fun Facts
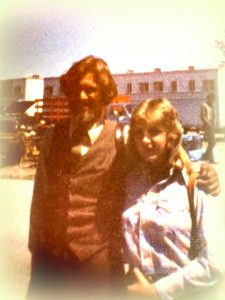
Meeting Kris
Movies
Heaven’s Gate (and the Missed Kiss)
3 years ago
Kris Fan
1 min read
10
2020
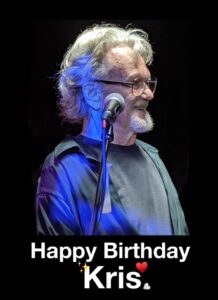
Happy 84th Birthday
4 years ago
bloggermelive
2 min read
2020
Fan Talent
Fans Speak
Fun Facts
Tributes
Gantry for Kristofferson
4 years ago
bloggermelive
 13 min read
 2 min read